Carsten Jung and Philippe Bracke

Whether in case of a breakup (Backstreet Boys), wondering why a relationship isn’t working (Mary J. Blige) or bad weather (Travis) – humans really care about explanations. The same holds in the world of finance, where firms increasingly deploy artificial intelligence (AI) software. But AI is often so complex that it becomes hard to explain why exactly it made a decision in a certain way. This issue isn’t purely hypothetical. Our recent survey found that AI already impacts customers – whether it’s calculating the price of an insurance policy or assessing a borrower’s credit-worthiness. In our new paper, we argue that so-called ‘explainability methods’ can help address this problem. But we also caution that, perhaps as with humans, gaining a deeper understanding of such models remains very hard.
The main difference between machine learning and more traditional models is that they are often more complex. For instance, a simple model, designed by a human, can take the form of an easy-to-describe line (Chart 1). Machine learning models, designed by an algorithm, can be very curvy and even have jumps. This makes them more flexible and means they can be more accurate. But it also means that they are harder to understand and explain. For this reason, they are sometimes called ‘black box’ models. In our paper, we use data from 6 million UK mortgages to estimate such a machine learning model, predicting how likely it is that people default on their loans.
Chart 1: Machine learning models can be more complex than traditional ones

Because of this difficulty to explain machine learning models, some financial institutions have refrained from using them in some contexts. Some observers have called for algorithms to be auditable, including through explainability techniques, and several organisations have published AI principles that demand it needs to be explainable. And there is an emerging computer science field developing ‘explainable AI’ methods, attempting to bridge this gap, some of which we apply in our paper.
But we argue there is no one-size-fits-all way of explaining a complex machine learning model, because different stakeholders will be interested in different types of explanations. Using the three songs from above, let’s explore what types of explanations there are and how these could look like in finance.
What caused individual events? – Type 1 explanations
When the Backstreet Boys ask: ‘Tell me why?’, they seem to be seeking an answer for a particular case. They’re asking why a particular person is ending a particular relationship. Similarly, a bank customer may be interested why the interest rate they got offered on their particular mortgage is high. They’re asking what it is about them that drove the decision. This, in turn, could help them determine what changes they would need to make to get a better rate. We call explanations about particular cases, type 1 explanations.
How do we arrive at such explanations? At the core of our approach is a method that treats our machine learning model as a black box and then performs tests on it, as shown in Chart 2. Comparing it to the Backstreet Boys’ breakup situation, it’s like asking the other person lots of questions about why they broke up: ‘Is it my looks?’; ‘Is it something I said?’ Our algorithm does exactly this to find out what the key drivers of a decision were. For instance, it might tell us that, for a specific individual in the data set, it was the high price of their house that drove the decision.
Chart 2: The core of our approach is testing – a trial and error algorithm

What is going on, generally speaking? – Type 2 and 3 explanations
In the Mary J. Blige track, she asks why two people (including her) that are so similar and, seemingly, such a good fit cannot make their relationship work. Arguably, here we have a more general question about the nature of love. She asks how love works, generally speaking. Similarly, a manager in a financial institution will likely be interested in understanding how a credit risk model works, generally. We call these explanations, type 2 explanations.
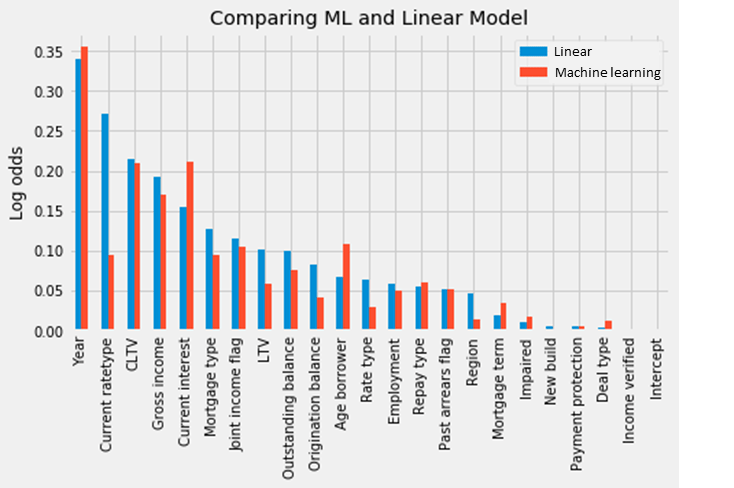
In our paper, we generate type 2 explanations through averaging over lots of type 1 explanations: we look at the drivers behind thousands of individual cases. These are shown in Chart 3. (The metric is log-odds – an indicator of likelihood.)
Further, if there is a new, fancy credit risk software, a bank manager may want to understand how it differs from an older, simpler version. Explanations that contrast complex models with simpler ones, we call type 3 explanations. Also in Chart 3, we show this comparison for our mortgage risk example. We find that, with few exceptions – such as the importance of the interest rate – the simple and the complex model actually have very similar key drivers overall.
Many explainability approaches stop at this point. But to gain a better understanding of the underlying mechanics of the machine learning model – to look under its bonnet – we need to dig deeper. This is when we get to Travis.
Chart 3: The age of the mortgage is the most important driver of default risk, both in a simple model and in a complex machine learning model
Looking under the bonnet of the model – Type 4 and 5 explanations

When Travis ask: ‘Why does it always rain on me?’ And ‘Sunny days, oh where have you gone?’, they seem to ask what on earth is going on? They are kind of asking ‘How does the weather ‘work’ that it is doing all these weird things?’ And also: ‘will it stay like this, in the future??’
Circling back to finance, similarly, a bank manager or financial regulator may be interested not just in what the key drivers of a decision are (type 2 explanations); but they may also want to understand the underlying mechanics of the model. These questions are asking for type 4 explanations.
In Chart 4, we show one way of explaining the mechanics of our mortgage risk machine learning model. It shows, for a sample of people (the blue dots), how the value of their mortgage’s interest rate influenced their predicted default risk. On the left-hand side, we show the simple (linear) model. The relationship is pretty straightforward. It’s a straight line. On the right-hand side is the machine learning model. We can immediately see that the relationship is more complex. It’s not a straight line, and not a neat curvy line either. It’s a slightly muddled up-and-down of dots. It’s thus harder to explain what exactly the modelled relationship between interest rate and default risk is. If we had to explain to somebody what’s going on in the right-hand side chart, we’d be a lot more hard pressed than in the case of the linear model on the left.
Chart 4: The relationship between the interest rate and default probability is straightforward in a linear model, but complicated in a machine learning one

Finally, both in the case of weird weather and when statistical models are used in finance, it is important to understand how they might perform in future, under novel conditions. In our framework, we call such explanations – asking what will happen when new types of data and novel scenarios occur – type 5 explanations.
Such explanations of how the model would assess novel data points are the hardest to comprehensively answer. To see this, in Chart 4, try to imagine how it would look like for values outside the area plotted in the graph – say, for an interest rate of 10%. In the linear model they would just fall on the extended line. In the machine learning model, we cannot just extend the existing line into new data regions, because there is no line! So-called ‘non-parametric models’ just have no lines. For this reason it is hard to know how machine learning models will work with new data unless we test for them explicitly.
And that’s just the way machine learning models are. They are geared to better fit a complex reality. But that comes at the expense of being more complex themselves. Explaining the workings of a machine learning model will therefore always have to be approximate.
The way forward
As our analysis shows, fully explaining the workings of complex machine learning models remains a really hard nut to crack. But there is hope. As the field of machine learning explainability evolves, new techniques will be invented that will provide increasingly better ways to looking under models’ bonnets. It will become easier to do and people will be better at knowing what to look for. And explainability approaches will be complemented by other approaches geared to making sure models work well.
Until then however, when we ask machine learning models to ‘tell us why!’, perhaps – like the Backstreet Boys – we will have to accept that we just ‘can’t reach their heart’.
Carsten Jung works in the Bank’s Research Hub and Philippe Bracke works at the Financial Conduct Authority.
If you want to get in touch, please email us at bankunderground@bankofengland.co.uk or leave a comment below.
Comments will only appear once approved by a moderator, and are only published where a full name is supplied.Bank Underground is a blog for Bank of England staff to share views that challenge – or support – prevailing policy orthodoxies. The views expressed here are those of the authors, and are not necessarily those of the Bank of England, or its policy committees.
An excellent article. Given the growing popularity of AI models, it’s nice to see someone still asking ‘but how do they work?’. Frequently the answer is ‘we don’t know’, so to categorise potential explanations into the options presented here is a welcome start.
Thoroughly enjoyed this post! Just wanted to congratulate the writers on a job well done being so innovative in how they presented their research
Before that though, I would start by asking human regulators why their risk weighted bank capital requirements are based on that what bankers perceive as risky is more dangerous to our bank systems than what bankers perceive, or regulators decree, as very safe.
http://perkurowski.blogspot.com/2016/04/here-are-17-reasons-for-why-i-believe.html